
Search results: “”
Chargers, Adapters
Showing 1–12 of 30 results
-
Moto 360 Micro USB Charger price in Pakistan
Sale!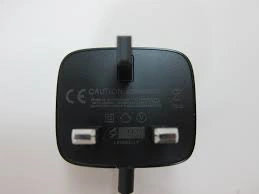 ₨350.00
Add to cart
₨350.00
Add to cart -
Ktec 12v 0.62a AC Power Adapter Charger Ksas7r51200062hu price in Pakistan
Sale!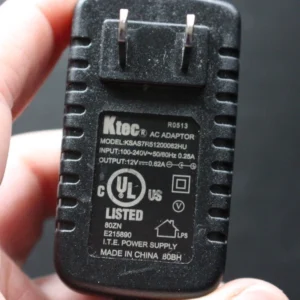 ₨800.00
Add to cart
₨800.00
Add to cart -
Netgear 7.5V 1.0A I.T.E Power Supply ( 332-10308-02 MU08A9075100-B2 ) price in Pakistan
Sale!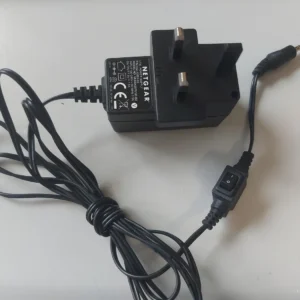 ₨600.00
Add to cart
₨600.00
Add to cart -
TP link switch charger price in Pakistan
Sale! ₨300.00
Add to cart
₨300.00
Add to cart -
GenuinNokia ACP-7X Mains Charger for Nokia Phones with the 3.5 mm Thick Pin Grade A price in Pakistan
Sale!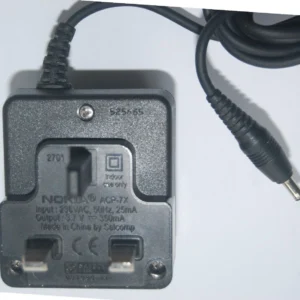 ₨700.00
Add to cart
₨700.00
Add to cart -
Jabra SSA-5W-09-AU-07506SF for Pro 9450 9460 9470 & Engage Bases price in Pakistan
Sale!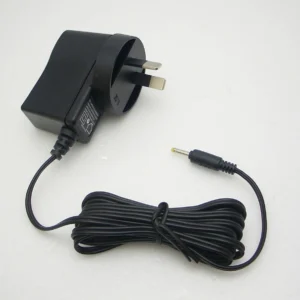 ₨500.00
Add to cart
₨500.00
Add to cart -
Genuine Nokia Mains Wall Charger C2 C5 C6 C3 C7 E6 FIT X2 X3 X5 X6 X7 E73 6300
Sale!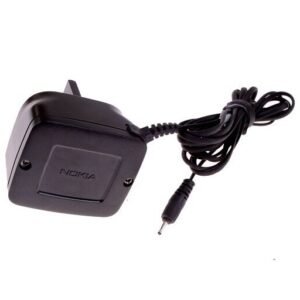 ₨250.00
Add to cart
₨250.00
Add to cart -
Original Charger NOKIA 301, 207, 208, 108, 130, 206 (micro USB) price in Pakistan
Sale!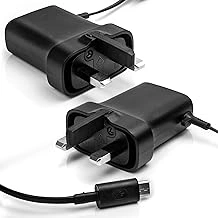 ₨250.00
Add to cart
₨250.00
Add to cart -
135 W HP laptop charger price in pakistan – HSTNN-DA01 8200 8000 DC7800 DC7900
Sale!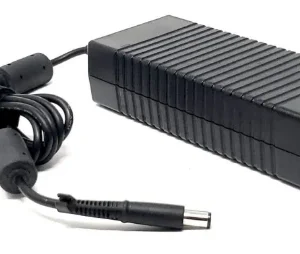 ₨2,000.00
Add to cart
₨2,000.00
Add to cart -
9V 1.1A 10W Ac Power Adapter For HP ElitePad 900 G1 ElitePad 1000 G2 686120-001 685735-003 HSTNN-DA34 Tablet Battery Charger price in pakistan
Sale!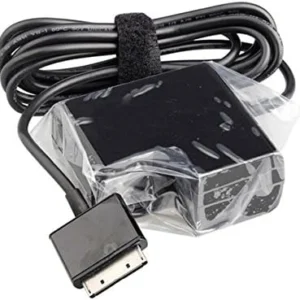 ₨2,000.00
Add to cart
₨2,000.00
Add to cart -
5V 4A AC Adapter For Lenovo Miix 310s 20W Charger IdeaPad 100s-10IBY 80NR 300-101BY 3.5*1.35mm price in pakistan
Sale!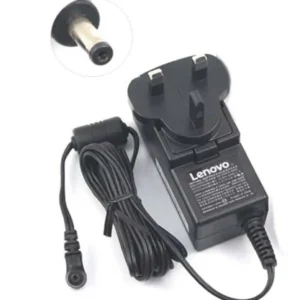 ₨800.00
Add to cart
₨800.00
Add to cart -
OEM Logitech DSA-12CA-12 120100 AC Adapter 12V 1A Switching Power Supply 4.0mm charger price in Pakistan
Sale! ₨1,000.00
Add to cart
₨1,000.00
Add to cart